
We reduced draw calls from 20,001 to 153 in a Unity scene with 20,000 animated cubes. Median frame time changed from 8.948 ms to 8.709 ms: a gain of just 0.24 ms.
A third mode, which removed the per-cube GameObjects and drew directly with Graphics.RenderMeshInstanced, reached 1.678 ms. The thread timings help explain why enabling GPU instancing alone made so little difference, and why the larger improvement needs a more careful explanation than “fewer draw calls.”
The three rendering modes
All three modes show the same scene: 20,000 cubes arranged in a disc, moving in a traveling sine wave while the camera slowly orbits. Every cube’s position changes every frame. Within each build type, the modes use the same executable and differ only in startup arguments.
- NAIVE: one GameObject and one MeshRenderer per cube, with GPU instancing disabled on the material
- INSTANCED_RENDERER: the same GameObject setup, with GPU instancing enabled on the material
- INSTANCED_DIRECT: no per-cube GameObjects; one script draws the cubes with
Graphics.RenderMeshInstanced
We measured this configuration:
- Unity 6000.4.11f1, Built-in Render Pipeline with forward rendering, Mono, and D3D12
- RTX 4070 Ti, Core i5-13500, and 1920x1080 resolution
- vSync and shadows disabled in every mode
- Dynamic and static batching disabled, with their respective batch counters confirmed at 0
Each mode ran for a 15-second warmup followed by 120 seconds of measurement. Timings came from a Release build; rendering counters came from a Development build to keep Development-build profiling overhead out of the timing comparison. The two tables therefore describe separate runs, not simultaneous measurements of the same frames.
Unless labeled otherwise, values are p50, the median. Frame-time p95 is the value at or below which 95% of measured frames fall. A higher p95 means slower frames near the tail of the distribution.
For Release-build FrameTimingManager measurements, enable Frame Timing Stats in Player Settings. See Unity's setup instructions. A missing or zero timing value is not evidence that the work costs nothing.
Frame times and rendering counters
| Mode | FPS | Frame time | Frame time p95 | Game thread | Render thread | GPU time | Memory |
|---|---|---|---|---|---|---|---|
| NAIVE | 111.8 | 8.948 ms | 10.644 ms | 8.920 ms | 0.480 ms | 0.909 ms | 169.0 MB |
| INSTANCED_RENDERER | 114.8 | 8.709 ms | 12.919 ms | 8.680 ms | 0.519 ms | 0.703 ms | 176.6 MB |
| INSTANCED_DIRECT | 596.0 | 1.678 ms | 2.774 ms | 1.668 ms | 0.091 ms | 0.232 ms | 56.6 MB |
GPU instancing alone barely changed median performance. It also did not improve every measure: average FPS fell from 111.2 to 109.0, frame-time p95 rose from 10.644 ms to 12.919 ms, and memory increased from 169.0 MB to 176.6 MB. A small p50 improvement is not enough to call this a consistent performance win.
| Mode | Standard draw calls | Instanced draw calls | Instance batches | SetPass Calls | Triangles |
|---|---|---|---|---|---|
| NAIVE | 20,001 | 0 | 0 | 153 | 240,002 |
| INSTANCED_RENDERER | 1 | 152 | 149 | 153 | 240,002 |
| INSTANCED_DIRECT | 20 | 40 | 59 | 2 | 240,002 |
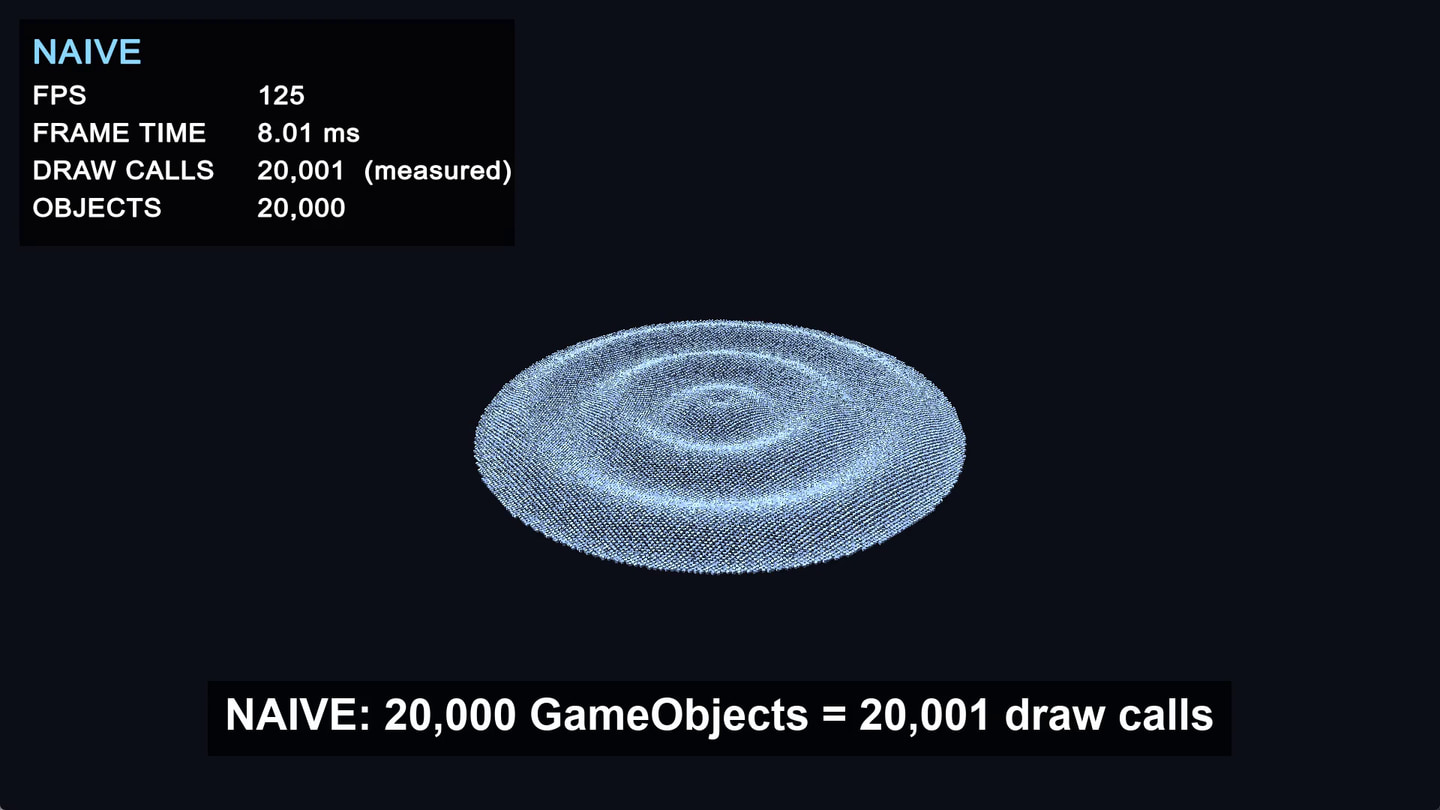
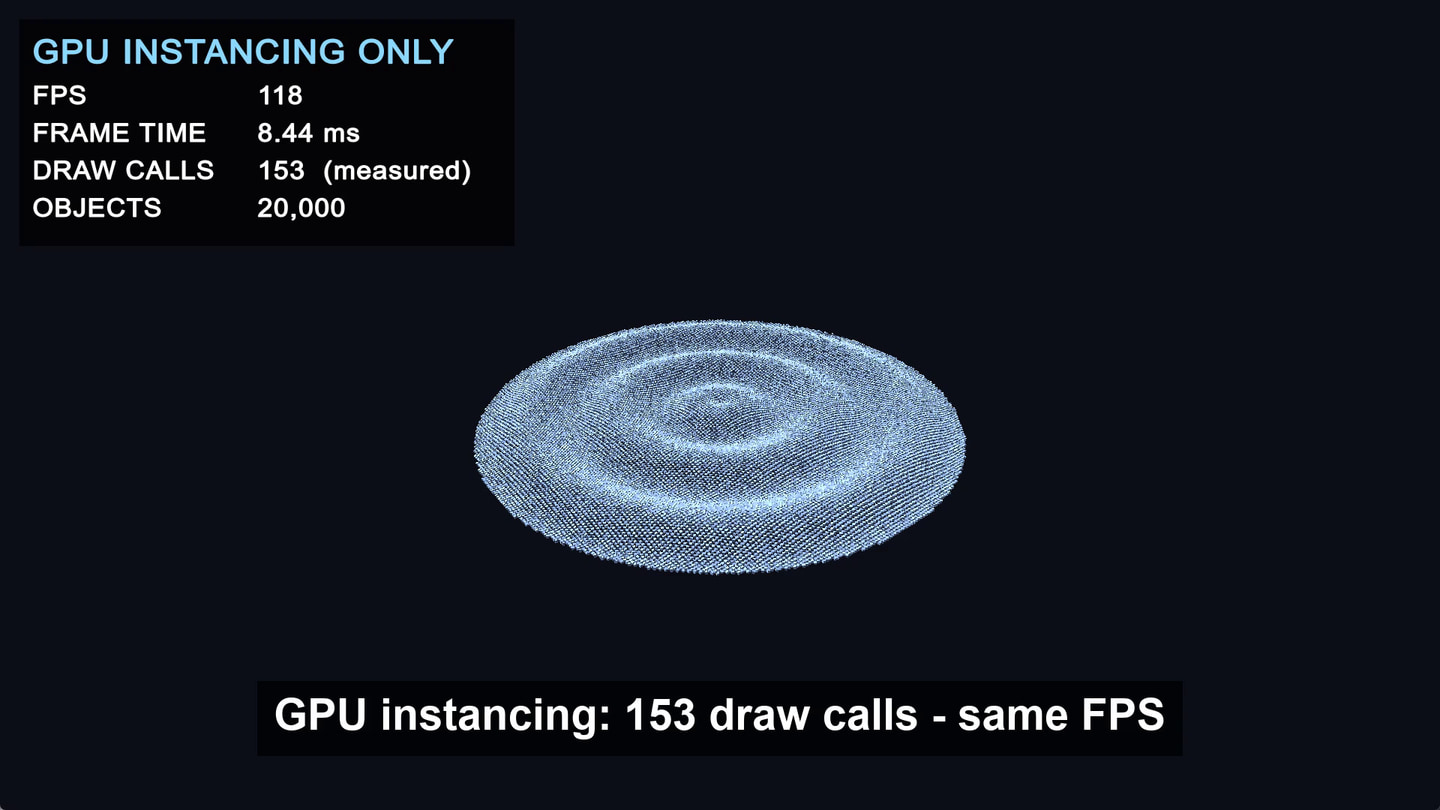
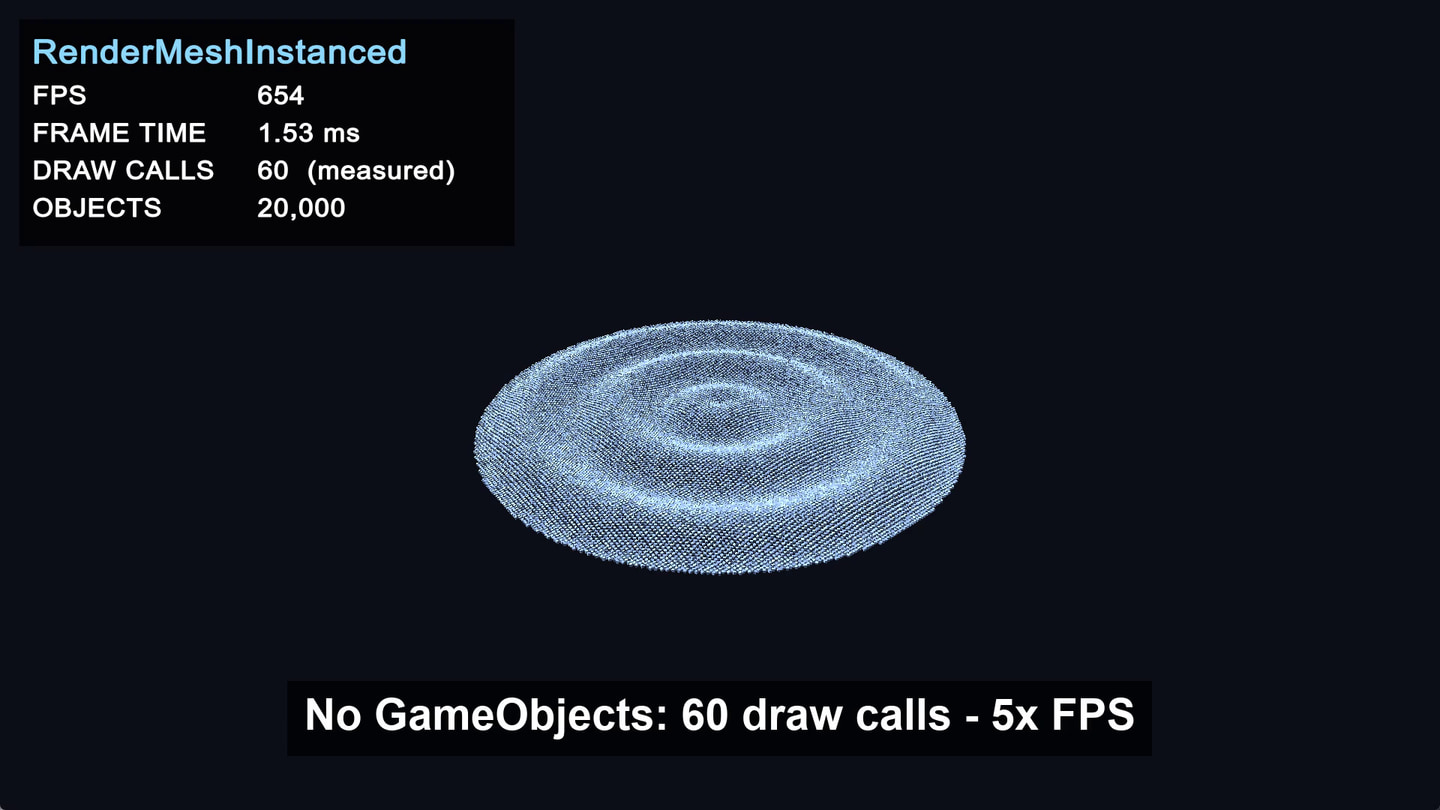
In this article, “draw calls” means standard plus instanced draw calls: 20,001 for NAIVE, 1 + 152 = 153 for INSTANCED_RENDERER, and 20 + 40 = 60 for INSTANCED_DIRECT. SetPass Calls is a separate metric, even where its value is also 153. Of NAIVE’s 20,001 draw calls, 20,000 draw cubes and one draws the rest of the scene.
The screenshots below show the three modes. Their overlays contain single-frame capture values, not the medians in the tables.
What the thread timings tell us
NAIVE’s game-thread time was 8.920 ms, almost equal to its 8.948 ms frame time. The render thread took 0.480 ms and the GPU 0.909 ms. Here, “game thread” refers to Unity’s main thread. These timings overlap; they are not costs to add together. Nor do separate p50 values describe one particular frame.
The comparison points to the main thread as the first place to investigate. INSTANCED_RENDERER supports that reading: despite the much lower draw-call count, its game-thread time remained at 8.680 ms. The render thread stayed near 0.5 ms, moving from 0.480 ms to 0.519 ms, while GPU time fell from 0.909 ms to 0.703 ms. Less GPU work did not translate into a comparable reduction in frame time.
For your own scene, use the timing breakdown to choose where to look next:
- Main-thread time near frame time: inspect scripts, Transform updates, and rendering preparation on the main thread
- Render-thread time near frame time: inspect rendering submission and state changes
- GPU time near frame time: inspect GPU work, including shaders, overdraw, and render passes
These are starting points, not a diagnosis from the largest number alone. Frame caps, presentation waits, and synchronization can affect the reading; Unity’s FrameTiming documentation describes the timing fields. Check the Profiler Timeline before assigning the cost to a subsystem. Main-thread time is not synonymous with game logic, and draw-call reduction can affect work on more than one thread.
What changed without per-cube GameObjects
INSTANCED_DIRECT removes the per-cube GameObject, Transform, and MeshRenderer. A single script updates an array of matrices and submits it for rendering each frame. The benchmark splits 20,000 matrices into chunks of 1,023, producing 20 C# API calls. Those calls do not map one-to-one to the counters in the table.
private void RenderInstanced()
{
    for (int start = 0; start < _objectCount; start += MaxInstancesPerCall)
    {
        int chunk = Mathf.Min(MaxInstancesPerCall, _objectCount - start);
        Graphics.RenderMeshInstanced(_renderParams, _cubeMesh, 0, _matrices, chunk, start);
    }
}
The chunk size is part of this benchmark, not a universal batching rule. Unity documents an upper bound of 1,023 instances, with an effective limit that depends on instance data and shader settings; the default two-matrix layout allows 511. Check the RenderMeshInstanced API reference when adapting this code.
Game-thread time fell to 1.668 ms, compared with 8.920 ms in NAIVE and 8.680 ms in INSTANCED_RENDERER. This supports investigating the cost of maintaining and updating the per-cube objects. Component processing, Transform synchronization, and culling are candidates, but these aggregate timings do not measure their individual contributions.
The direct mode also changes the rendering path, so this experiment cannot isolate a “GameObject-only” saving. SetPass Calls fell from 153 to 2, and GPU time from NAIVE’s 0.909 ms to 0.232 ms. The result belongs to the combined change in object representation and rendering.
Memory fell from 169.0 MB to 56.6 MB, about 112 MB. Dividing that difference by 20,000 gives roughly 5.6 KB per cube, not a general memory cost for one GameObject. The SDK uses Profiler.GetTotalAllocatedMemoryLong, which reports memory in use by Unity’s internal allocators, rather than the process’s full memory footprint.
The direct mode still allocates about 1.28 MB for 20,000 Matrix4x4 values. All three modes draw 240,002 triangles, so the memory saving did not require reducing the displayed geometry. Equal triangle counts alone do not identify which allocations disappeared.
Comparing the runs with Framedash
For this experiment, Framedash collected the timings and compared the runs. The Unity SDK sends frame_time_ms, game_thread_ms, render_thread_ms, and gpu_time_ms in perf_heartbeat events. We used a different build_id in BeginAutomatedSession for each mode, then compared NAIVE with INSTANCED_DIRECT using the CLI.
Set the two variables to the corresponding build IDs before running:
framedash perf-diff --baseline "$NAIVE_BUILD_ID" --candidate "$INSTANCED_DIRECT_BUILD_ID" \
  --threshold 5 --fail-on-regression
The recorded output was:
- Frame time p50: 9.011 ms to 1.701 ms (-81.12%)
- GPU time: 0.9257 ms to 0.2406 ms (-74.00%)
- Memory: 175.7 MB to 59.4 MB (-66.20%)
- 133 samples per mode; verdict: “No performance regression beyond 5%”
These values differ from the tables because they summarize different samples. After warmup, the server combined events sent once per second during the 120-second automated session with perf_heartbeat events sent every 10 seconds, yielding 133 samples per mode. The tables use per-frame samples. The decimal precision above follows the recorded server output.
That comparison can be run from CI before release, but its sampled p50 is not a substitute for a per-frame tail analysis. The verdict applies to the metrics and threshold being compared; it does not identify a bottleneck or prove that every frame became faster.
What this experiment does and does not establish
This is one workload on one hardware and software configuration, with every cube moving every frame. It establishes that enabling GPU instancing alone gave little median frame-time benefit in this test, while the direct mode was much faster. It does not establish the expected gain for a scene with mostly static objects or different rendering costs.
Mobile hardware, other graphics APIs, URP or HDRP with the SRP Batcher, IL2CPP, and shadows can change the balance of work. The rendering counters also varied widely between frames, so the article uses medians to summarize them. The reported runs do not establish run-to-run variability; repeat the baseline before interpreting a small difference such as 0.24 ms as a reliable gain.
What to check before reducing draw calls
- Capture valid main-thread, render-thread, and GPU timings in a representative build. Check frame caps and waits before interpreting them.
- Use the Profiler to locate the expensive work. A high main-thread time is a reason to inspect object updates, not by itself a reason to remove GameObjects.
- Change one suspected cost where possible, repeat the same workload, and compare median frame time, slower frames, and memory.
- Metric definitions: data model
- SDK setup: Unity SDK guide