
A Unity game’s memory usage can look different in the Framedash dashboard, Task Manager, and a C# heap counter. In our Windows demo drawing 20,000 cubes, those readings were 167 MB, 739 MB, and 8 MB. They came from different observations: the dashboard and heap figures are medians from separate runs, while Task Manager’s 739 MB is a single-moment reading.
The first thing to check is what each counter measures. Framedash’s Unity SDK reports memory in use by Unity’s allocators, which is different from either the managed heap or the process’s physical-memory footprint. To compare the counters under controlled conditions, we recorded eight readings in every frame of the same build.
Four ways to define memory usage
The readings cover four scopes. Thinking of them as layers helps distinguish the questions they answer, but they are not four nested boxes.
- Managed heap: memory for C# objects such as class instances and arrays, managed by the garbage collector
- Unity allocated memory: memory in use within Unity’s allocator pools, including engine-side allocations such as texture data beyond the managed heap
- Unity reserved memory: the full allocator pools Unity holds from the OS, including capacity available for reuse
- Process memory: the OS view, which also accounts for memory outside Unity’s allocators, such as executable and DLL mappings
The OS itself provides more than one view. The working set counts pages resident in physical memory; private commit counts memory committed for the process’s exclusive use, whether resident or paged out. In this test the OS readings were larger than Unity’s, but you cannot subtract one scope from another to obtain a reliable breakdown. Graphics-driver memory is a separate counter, not another enclosing layer.
Drawing 20,000 cubes two ways
We used the project from the previous post, with two ways of drawing the same 20,000 cubes:
- Naive: one GameObject and one MeshRenderer per cube
- InstancedDirect: no per-cube GameObject; a script draws the cubes with
Graphics.RenderMeshInstanced
These correspond to NAIVE and INSTANCED_DIRECT in the previous post. The environment was Unity 6000.4.11f1, the Built-in Render Pipeline, D3D12, the Mono scripting backend, an RTX 4070 Ti, and 1920x1080. The main table uses release players with telemetry transmission off.
Each mode ran a 15-second warmup followed by 120 seconds of measurement. In this experiment, we took all eight readings in the same frame, immediately after the SDK’s Collect() call. Each table entry is that counter’s median (p50) over the measured frames. The row values therefore do not describe a single frame.
In the tested Mono player, System.Diagnostics.Process.WorkingSet64 and PrivateMemorySize64 both returned 0. We used P/Invoke to call psapi's GetProcessMemoryInfo instead. A cross-check against Get-Process running outside the player gave medians of 848.5 MB and 848.7 MB, a difference of 0.2 MB.
Eight readings, each summarized over 120 seconds
| Reading | Naive | InstancedDirect | Change |
|---|---|---|---|
GetMonoUsedSizeLong |
8.2 MB | 6.9 MB | -16% |
GC.GetTotalMemory(false) |
8.2 MB | 6.9 MB | -16% |
GetMonoHeapSizeLong |
10.3 MB | 7.9 MB | -23% |
GetTotalAllocatedMemoryLong |
167.2 MB | 56.6 MB | -66% |
GetTotalReservedMemoryLong |
263.4 MB | 155.2 MB | -41% |
| OS working set | 852.4 MB | 412.0 MB | -52% |
| OS private (commit) | 1,168.3 MB | 681.9 MB | -42% |
GetAllocatedMemoryForGraphicsDriver |
0 | 0 | - |
The shaded row is the counter the Framedash Unity SDK sends. Frame-time p50 was 9.25 ms for Naive and 1.44 ms for InstancedDirect, consistent with the previous post. That post’s 169.0 MB and this run’s 167.2 MB came from separate runs with the same build configuration and arguments; both use the allocated-memory counter.
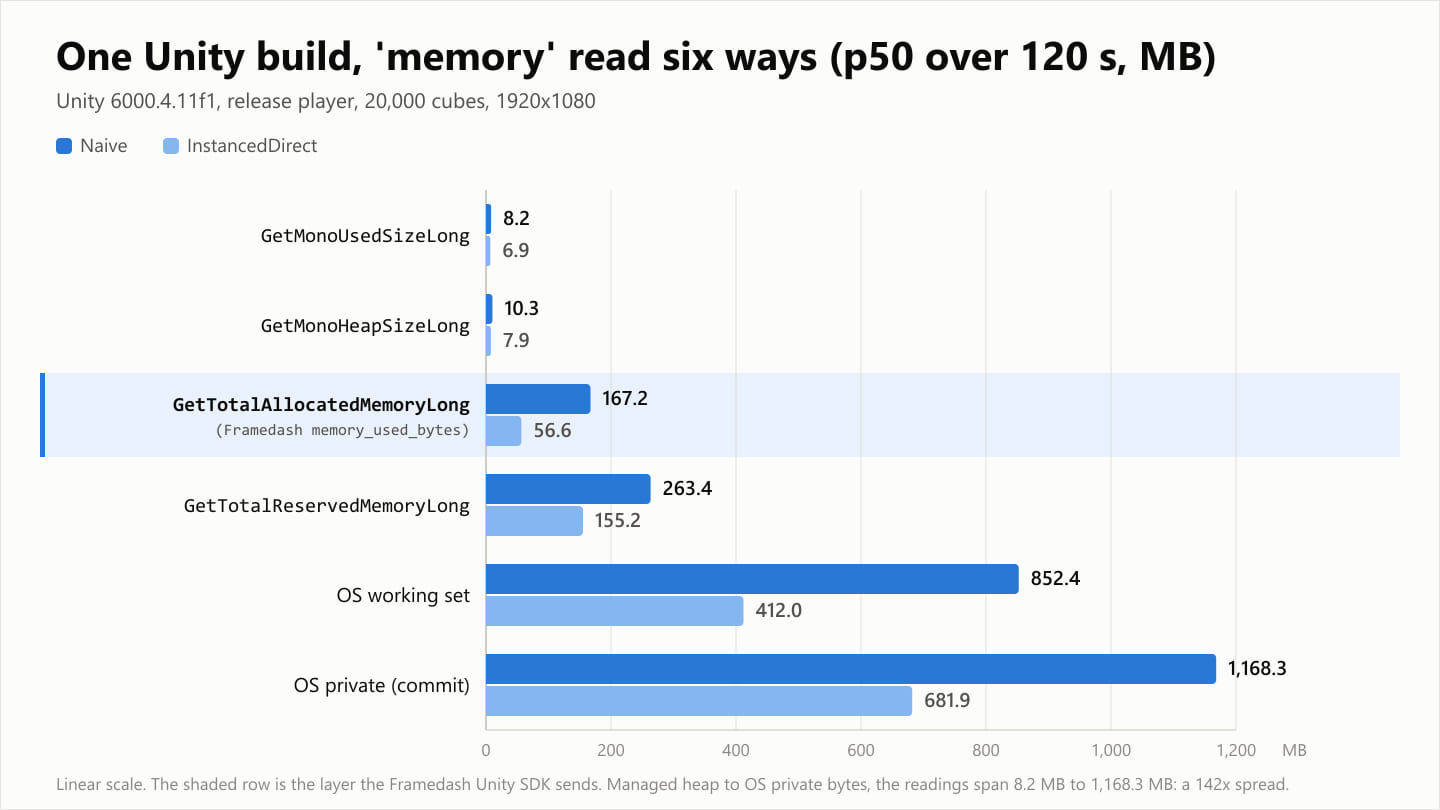
GC.GetTotalMemory(false) equals GetMonoUsedSizeLong at this precision, and GetAllocatedMemoryForGraphicsDriver is 0 in the release player. The dark bar is Naive, the light bar is InstancedDirect, and the shaded row is the layer the Framedash Unity SDK sends.Switching from Naive to InstancedDirect reduced Unity allocated memory by 66%, managed-heap usage by 16%, and managed-heap capacity by 23%. All three describe the same change. A claim such as “memory fell 66%” needs the counter name to be useful.
What the counters tell us
Managed-heap usage and capacity
GetMonoUsedSizeLong reports managed-heap usage, including objects awaiting collection; GetMonoHeapSizeLong reports its capacity. Their Naive medians were 8.2 MB and 10.3 MB, a difference of 2.1 MB. The heap has room that is not currently occupied by objects, though subtracting these medians is not a separate measurement of free space.
GC.GetTotalMemory(false) matched the used-heap reading at the displayed precision on this Mono backend. That agreement is a result of this test, not a promise for every backend. Heap usage also does not measure allocation rate or collection time. For GC-related frame-time problems, inspect per-frame allocations and collection activity in the Profiler alongside heap size.
Unity’s used and reserved allocator pools
GetTotalAllocatedMemoryLong reports memory in use within Unity’s allocator pools. The 8.2 MB managed-heap reading is only about 5% of the 167.2 MB allocated reading. Its small decline cannot explain the 110.6 MB reduction in allocated memory. That points to native engine memory as the main saving in this mode change, although this test does not provide an object-by-object breakdown.
GetTotalReservedMemoryLong includes unused capacity in those pools. Naive reserved 263.4 MB and used 167.2 MB; the difference between those medians is 96.2 MB. For InstancedDirect it is 98.6 MB, almost unchanged. This explains why the percentage reductions differ, 41% reserved versus 66% allocated, even though the absolute reductions are close: 108.2 MB and 110.6 MB. These differences between medians are not separately sampled unused-memory values.
Process working set and private commit
The OS working set counts pages currently resident in physical memory, including shared pages. Task Manager calls this Working set. Private commit counts committed memory exclusive to the process, including memory that has been paged out; it corresponds to Commit size.
Naive’s working-set median of 852.4 MB exceeds its allocated-memory median of 167.2 MB by 685.2 MB. That gap is a difference between counters with different definitions, not a measured category of memory. Executable and DLL mappings, graphics-driver allocations, and plugin allocations can sit outside Unity’s allocator tracking. This experiment does not determine how much each contributes.
Graphics-driver memory and an unavailable reading
GetAllocatedMemoryForGraphicsDriver provides readings in the Editor and development players, with native reporting gated by ENABLE_PROFILER. It returned 0 in our release players and 99.0 MB in both development modes. We observed no difference between the modes at this precision.
The release value of 0 means the reading was unavailable, not that the driver used no memory. Framedash omits mem.vram when this API does not return a positive value.
Why Task Manager shows another number
On Task Manager’s Processes tab, the executable’s Memory column read 738.7 MB. At the same time, external queries returned a working set of 795.5 MB and private commit of 1,091.3 MB. The displayed column was the private working set: resident pages exclusive to the process. It excludes shared resident pages and paged-out private memory, so it matches neither OS counter in the table.
Those single-moment observations also differ from the table’s medians of 852.4 MB and 1,168.3 MB over 120 seconds. Both the counter and the sampling window matter.
Keep the build type fixed when comparing changes
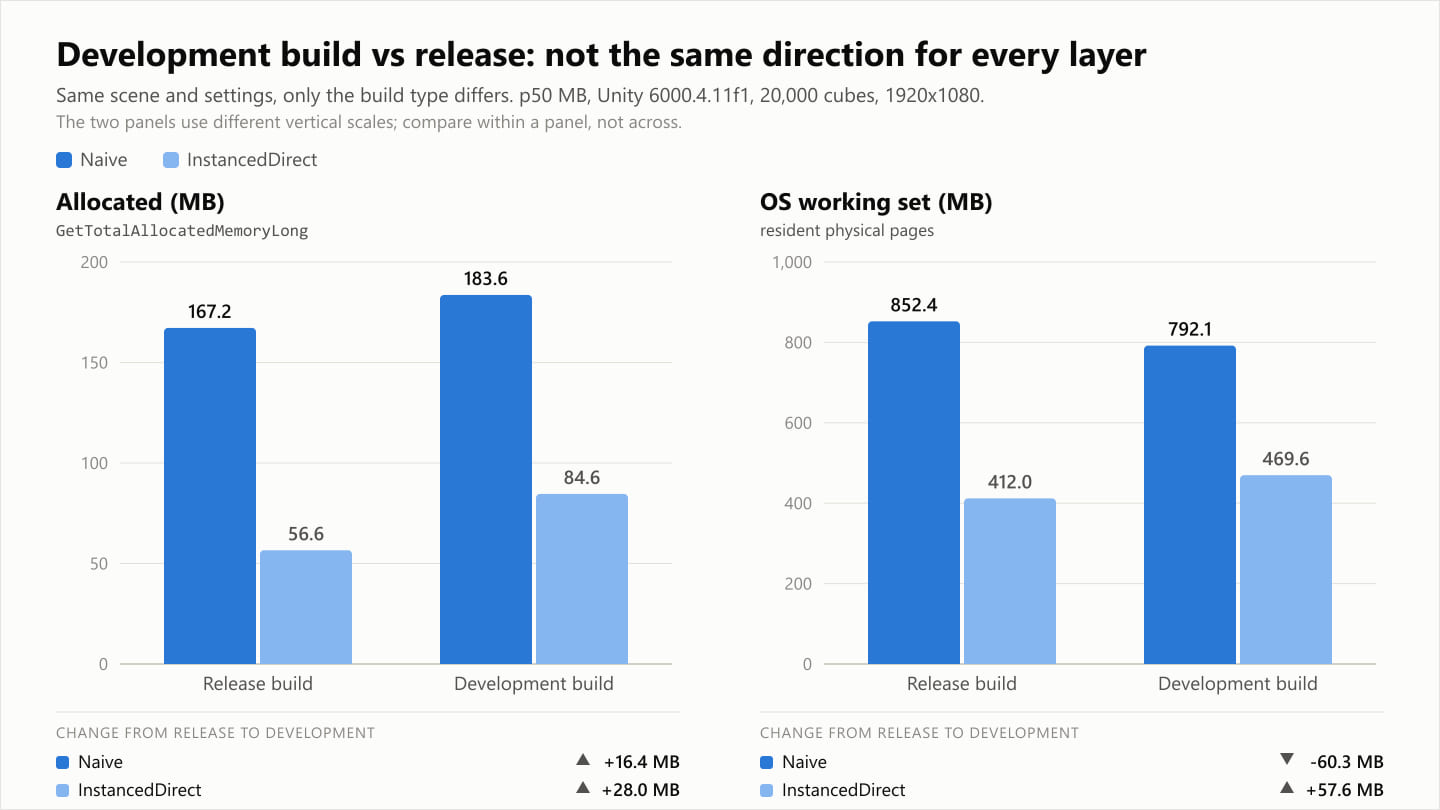
We also measured both modes in development builds. Allocated memory was 183.6 MB and 84.6 MB; reserved memory was 337.7 MB and 221.5 MB. All four exceeded the release figures: 167.2 MB and 56.6 MB allocated, 263.4 MB and 155.2 MB reserved. Development builds include profiling instrumentation, but this comparison does not isolate its share of the increase.
The working set moved in opposite directions: 792.1 MB for Naive, below its release result, and 469.6 MB for InstancedDirect, above it. A rise in allocator usage need not produce a matching rise in resident pages. To judge an optimization, compare release with release or development with development. Otherwise, the build configuration becomes another variable.
What Framedash puts in its memory field
Its wire schema has one int64 field, memory_used_bytes, but the source depends on the engine. The dashboard divides bytes by 1048576 and labels the result MB; that divisor corresponds to MiB.
- Unity:
Profiler.GetTotalAllocatedMemoryLong(), the counter that read 167.2 MB and 56.6 MB here. The SDK includes it in theperf_heartbeatsent every 10 seconds - UE5:
FPlatformMemory::GetStats().UsedPhysical, a platform-specific process physical-memory statistic, rather than Unity’s allocator counter - Godot (C#):
Performance.Monitor.MemoryStaticwhen it returns a positive reading; otherwise the SDK falls back toSystem.GC.GetTotalMemory(false). Exported release builds commonly use this managed-heap fallback
In Godot, the same field can therefore change meaning with the build configuration. Do not compare it across builds that use different sources. The Unity readings of 8.2 MB for the managed heap and 167.2 MB for allocated memory illustrate the distinction; they are not a conversion factor for Godot.
The Unity SDK also attaches mem.heap from GetMonoUsedSizeLong and mem.vram from GetAllocatedMemoryForGraphicsDriver when the respective API returns a positive value. A missing key is not a zero-byte measurement.
The run with telemetry enabled
With the SDK transmitting telemetry in a separate run, GetMonoUsedSizeLong p50 rose from 8.2 MB to 9.8 MB in Naive and from 6.9 MB to 8.8 MB in InstancedDirect. Allocated memory was 167.0 MB and 56.6 MB, and the working set was 857.3 MB and 415.3 MB. Those allocated and working-set readings were all within 5 MB of their telemetry-off counterparts.
The managed-heap increases of 1.6 MB and 1.9 MB are observations for this configuration, not a general SDK overhead estimate. The results do not separate event buffers, serialization, and SDK logging, and the run records do not establish whether the logging settings matched.
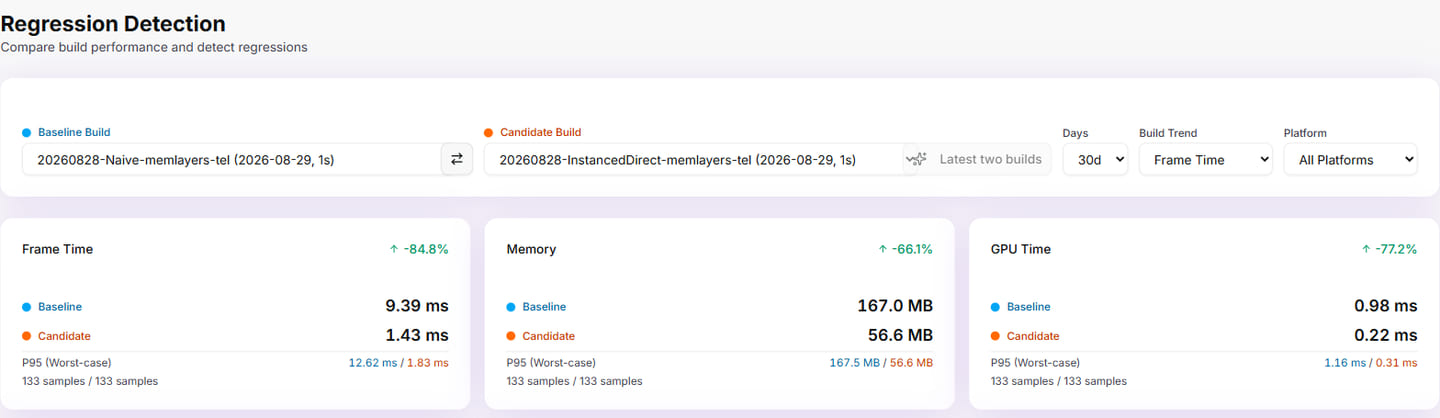
Framedash’s build comparison shows p50 and p95 together. The p95 can reveal increases among higher readings even when the median stays similar, but it is not the peak. framedash perf-diff can run from CI for a pre-release build comparison. Check the sampling population before comparing its output with a per-frame benchmark.
Where these results apply
The measurements cover Windows, D3D12, Mono, a desktop GPU, and 1920x1080. We did not test IL2CPP or another resolution. The workload rewrites all 20,000 positions every frame. Other platforms, backends, resolutions, and workloads need their own measurements; the relationships and reductions here are not general Unity ratios.
Choose a counter, then keep the comparison consistent
A report saying only “memory is 852 MB” leaves out what was counted. The same run also produced 8.2 MB and 1,168.3 MB. Choose the measurement for the question:
- To check a change in Unity’s allocator usage, compare allocated memory; use reserved memory to see the pool capacity as well
- To assess device memory demands, inspect process working set and commit on the target platform, including peaks. A 120-second median alone cannot establish that the game will fit
- To investigate garbage collection, examine managed-heap usage together with allocation rate and collection activity
For a before-and-after test, keep the counter, platform, scripting backend, build type, resolution, workload, and telemetry settings consistent. Use the same warmup, sampling cadence, and aggregation window. A Task Manager snapshot, a per-frame p50, and a percentile of telemetry events answer different questions even when all three display MB.
- Data model: definitions of the metrics the SDK sends
- Unity SDK guide: setup and collection details